こんにちは。
今回は、GUIグラフ操作アプリケーションを所用で作りたくなったので、備忘録として記載します。
①やりたいこと
・読み込んだデータをグラフ描写。
・シフト&スケール変更して、2つのスペクトルが一致する値を見つける。
特に3番目のシフト&スケール変更を、スライダーなどのマウス操作でグリグリ動かしたいので、今回GUIアプリケーションを作ることにしました。
GUIアプリの開発は全くの初心者ですが、とりあえずメジャーそうなTkinterというライブラリで作っていきます。
②必要なライブラリ
・Pandas
・Matplotlib
はい、非常にシンプルですね。追加のライブラリは必要なさそうです。
③App1:データの読み込み&グラフ描写
[App1]
import tkinter as tk
from matplotlib.backends.backend_tkagg import FigureCanvasTkAgg, NavigationToolbar2Tk
import matplotlib.pyplot as plt
import pandas as pd


class Application(tk.Frame):
    def __init__(self, master=None):
        super().__init__(master)
        self.master = master
        self.master.title('Application1')
        self.pack()
        self.create_widgets()

    def create_widgets(self):
        #----------------------plot1-------------------------------------------------------------------------
        self.Frame1 = tk.Frame(self.master)
        self.Frame1.pack(side=tk.TOP)

        self.Button11 = tk.Button(self.Frame1, text="Reference", command=lambda: self.load_data(self.entry1))
        self.Button11.pack(side=tk.LEFT)

        self.entry1 = tk.Entry(self.Frame1, width=100)
        self.entry1.pack(side=tk.LEFT)

        self.Button12 = tk.Button(self.Frame1, text="Plot data", command=lambda: self.plot_data(self.entry1, self.plot1))
        self.Button12.pack(side=tk.LEFT)


        #----------------------plot2-------------------------------------------------------------------------
        self.Frame2 = tk.Frame(self.master)
        self.Frame2.pack(side=tk.TOP)

        self.Button21 = tk.Button(self.Frame2, text="Reference", command=lambda: self.load_data(self.entry2))
        self.Button21.pack(side=tk.LEFT)

        self.entry2 = tk.Entry(self.Frame2, width=100)
        self.entry2.pack(side=tk.LEFT)


        self.Button22 = tk.Button(self.Frame2, text="Plot data", command=lambda: self.plot_data(self.entry2, self.plot2))
        self.Button22.pack(side=tk.LEFT)


        #----------------------figure-------------------------------------------------------------------------
        self.Frame3 = tk.Frame(self.master)
        self.Frame3.pack(side=tk.TOP)

        self.canvas = FigureCanvasTkAgg(fig, self.Frame3)
        self.canvas.draw()
        self.canvas.get_tk_widget().pack(side=tk.TOP, fill=tk.BOTH, expand=True)

        self.plot1, = ax.plot([],[], label='data1', c='blue')
        self.plot2, = ax.plot([],[], label='data2', c='red')


        self.toolbar = NavigationToolbar2Tk(self.canvas, self.Frame3)
        self.toolbar.update()
        self.canvas.get_tk_widget().pack(side=tk.TOP, fill=tk.BOTH, expand=True)
        #----------------------end-------------------------------------------------------------------------

    def load_data(self, entry):
        file_path = tk.filedialog.askopenfilename()
        entry.insert(tk.END, file_path)

    def plot_data(self, entry, plot):
        filename = entry.get()
        try:
            df = pd.read_csv(filename, header=0)
            x_org = df.iloc[:,0]
            y_org = df.iloc[:,1]
        except:
            x_org = []
            y_org = []

        plot.set_xdata(x_org)
        plot.set_ydata(y_org)

        self.canvas.draw()


fig = plt.Figure(figsize=(10, 10))
ax = fig.add_subplot(111)
ax.set_xlim(-1,1)
ax.set_ylim(-1,1)

root = tk.Tk()
app = Application(master=root)
app.mainloop()
・パーツの配置方法
Tkinterでは基本的に、画面上のパーツの配置は「Frame」という単位で行うようです。
必要なボタン(tk.Button())などをつけたFrameを、tk.Tk()で作成したウインドウ上に配置していきます。
・ボタンへの関数の割り当て
Frame1、Frame2でデータの読み込み部分を作ります。
データ参照のためのButton1には、ファイル選択画面が出てくる関数を割り当てます。
選択したファイルのパスを、エントリーボックス(entry1、entry2)に挿入するようにしています。
なお、Tkinterのボタンに割り当てる関数には、引数をそのまま与えることはできません。
(NG例:tk.Button(command=function(arg1, arg2…) )
そこで、ラムダ式として、引数を指定した関数を指定しています。
・グラフの配置
Frame3にMatplotlibのグラフを配置しています。
なお、axisには空のプロット(ax.plot([], []))を配置しておき、データを読み込んだのちに、.set_xdata()、.set_ydata()で値を更新する形にしておきます。(App2でplotをグリグリ操作するのに必要な部分です。)
またグラフ下部には、グラフのツールバー(Pyplotで通常出てくるやつ)を表示するようにしておきます。
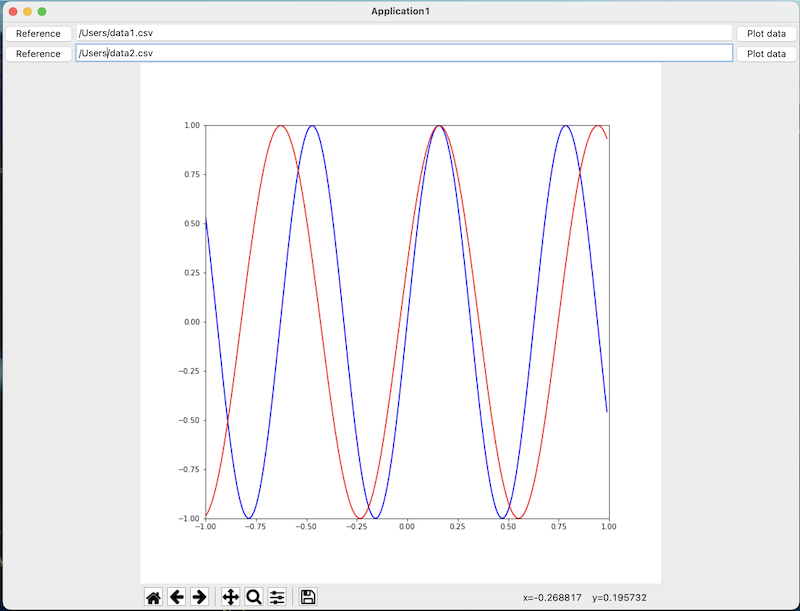
無事、グラフ描写するアプリケーションを作ることができました。
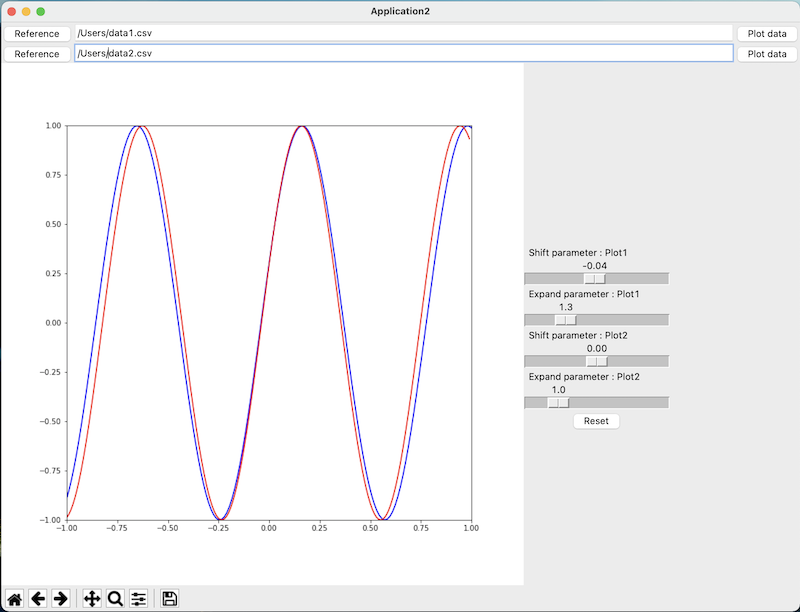
④App2:スライダーによる変数の更新と再描写
[App2]
import tkinter as tk
from matplotlib.backends.backend_tkagg import FigureCanvasTkAgg, NavigationToolbar2Tk
import matplotlib.pyplot as plt
import pandas as pd


class Application(tk.Frame):
    def __init__(self, master=None):
        super().__init__(master)
        self.master = master
        self.master.title('Application2')
        self.pack()
        self.create_widgets()
        self.scale_default()

    def create_widgets(self):
        #----------------------plot1-------------------------------------------------------------------------
        self.Frame1 = tk.Frame(self.master)
        self.Frame1.pack(side=tk.TOP)

        self.Button11 = tk.Button(self.Frame1, text="Reference", command=lambda: self.load_data(self.entry1))
        self.Button11.pack(side=tk.LEFT)

        self.entry1 = tk.Entry(self.Frame1, width=100)
        self.entry1.pack(side=tk.LEFT)

        self.Button12 = tk.Button(self.Frame1, text="Plot data", command=lambda: self.plot_data(self.entry1, self.plot1, self.org_data1))
        self.Button12.pack(side=tk.LEFT)


        #----------------------plot2-------------------------------------------------------------------------
        self.Frame2 = tk.Frame(self.master)
        self.Frame2.pack(side=tk.TOP)

        self.Button21 = tk.Button(self.Frame2, text="Reference", command=lambda: self.load_data(self.entry2))
        self.Button21.pack(side=tk.LEFT)

        self.entry2 = tk.Entry(self.Frame2, width=100)
        self.entry2.pack(side=tk.LEFT)

        self.Button22 = tk.Button(self.Frame2, text="Plot data", command=lambda: self.plot_data(self.entry2, self.plot2, self.org_data2))
        self.Button22.pack(side=tk.LEFT)


        #----------------------figure-------------------------------------------------------------------------
        self.Frame3 = tk.Frame(self.master)
        self.Frame3.pack(side=tk.LEFT)

        self.canvas = FigureCanvasTkAgg(fig, self.Frame3)
        self.canvas.draw()
        self.canvas.get_tk_widget().pack(side=tk.TOP, fill=tk.BOTH, expand=True)

        self.org_data1=[[],[]]
        self.plot1, = ax.plot(self.org_data1[0],self.org_data1[1], label='data1', c='blue')

        self.org_data2=[[],[]]
        self.plot2, = ax.plot([],[], label='data2', c='red')


        self.toolbar = NavigationToolbar2Tk(self.canvas, self.Frame3)
        self.toolbar.update()
        self.canvas.get_tk_widget().pack(side=tk.TOP, fill=tk.BOTH, expand=True)


        #----------------------control-------------------------------------------------------------------------
        self.Frame4 = tk.Frame(self.master)
        self.Frame4.pack(side=tk.LEFT)

        self.shift_plot1 = tk.DoubleVar()
        self.scale_shift1 = tk.Scale(self.Frame4, variable=self.shift_plot1, from_ = -1, to=1, resolution=0.02,length=200,
                                     label='Shift parameter : Plot1', orient=tk.HORIZONTAL, command=self.change_plot1)
        self.scale_shift1.pack(side=tk.TOP)

        self.expand_plot1 = tk.DoubleVar()
        self.scale_expand1 = tk.Scale(self.Frame4, variable=self.expand_plot1, from_ = 0.1, to=5, resolution=0.1,length=200,
                                     label='Expand parameter : Plot1', orient=tk.HORIZONTAL, command=self.change_plot1)
        self.scale_expand1.pack(side=tk.TOP)


        self.shift_plot2 = tk.DoubleVar()
        self.scale_shift2 = tk.Scale(self.Frame4, variable=self.shift_plot2, from_ = -1, to=1, resolution=0.02,length=200,
                                     label='Shift parameter : Plot2', orient=tk.HORIZONTAL, command=self.change_plot2)
        self.scale_shift2.pack(side=tk.TOP)

        self.expand_plot2 = tk.DoubleVar()
        self.scale_expand2 = tk.Scale(self.Frame4, variable=self.expand_plot2, from_ = 0.1, to=5, resolution=0.1,length=200,
                                     label='Expand parameter : Plot2', orient=tk.HORIZONTAL, command=self.change_plot2)
        self.scale_expand2.pack(side=tk.TOP)


        self.Button41 = tk.Button(self.Frame4, text="Reset", command=self.reset_scale)
        self.Button41.pack(side=tk.TOP)


        #----------------------create_widgets END-------------------------------------------------------------------------

    def load_data(self, entry):
        file_path = tk.filedialog.askopenfilename()
        entry.insert(tk.END, file_path)

    def plot_data(self, entry, plot, org_data):
        filename = entry.get()
        try:
            df = pd.read_csv(filename, header=0)
            x_org = df.iloc[:,0]
            y_org = df.iloc[:,1]
        except:
            x_org = []
            y_org = []

        org_data.clear()
        org_data.append(x_org)
        org_data.append(y_org)

        plot.set_xdata(x_org)
        plot.set_ydata(y_org)

        self.canvas.draw()


    def scale_default(self):
        self.shift_plot1.set(0.0)
        self.expand_plot1.set(1.0)
        self.shift_plot2.set(0.0)
        self.expand_plot2.set(1.0)


    def reset_scale(self):
        self.scale_default()
        self.change_plot1()
        self.change_plot2()


    def change_plot1(self, event=None):
        a=self.expand_plot1.get()
        b=self.shift_plot1.get()
        x=a*self.org_data1[0]+b
        y=self.org_data1[1]
        self.plot1.set_xdata(x)
        self.plot1.set_ydata(y)

        self.canvas.draw()

    def change_plot2(self, event=None):
        a=self.expand_plot2.get()
        b=self.shift_plot2.get()
        x=a*self.org_data2[0]+b
        y=self.org_data2[1]
        self.plot2.set_xdata(x)
        self.plot2.set_ydata(y)

        self.canvas.draw()


fig = plt.Figure(figsize=(10, 10))
ax = fig.add_subplot(111)
ax.set_xlim(-1,1)
ax.set_ylim(-1,1)

root = tk.Tk()
app = Application(master=root)
app.mainloop()
・制御変数とスライダー
シフトとスケールの大きさを決める変数は、shift_plot1、expand_plot1として、tk.DoubleVar()という、浮動小数点値を格納できるTkinterの変数として定義しています。(controlの部分)
この変数を作成したスライダーの変数として指定(tk.Scale(variable=))すればOKです。
・データの計算&再描写を定義
グラフデータのX方向へのシフト&スケール変更は、change_plot1()、change_plot1()で定義しました。
再描写は、最初と同じく.set_xdata()、.set_ydata()で値を更新します。
引数が多くなり面倒になったので、ここはplot1、plot2それぞれ同じ内容の関数を定義しています。
○まとめ
今回は初めて、GUIのアプリケーションを作ってみました。
ボタンの配置など、細かい指定が必要なので、普段のデータ分析などと比べると、必然的にコード文量が多くなります。
文量が多くなる分、可読性などの観点から、オブジェクト指向の書き方の習得が必要になってきます。
学習コストは若干高いですが、良い勉強になりました。
今回は以上です。
ご参考になれば幸いです!